Blockchain Intelligence Dashboard
Interface over on-chain activity: address monitoring, transaction views, and charting on top of indexed data.
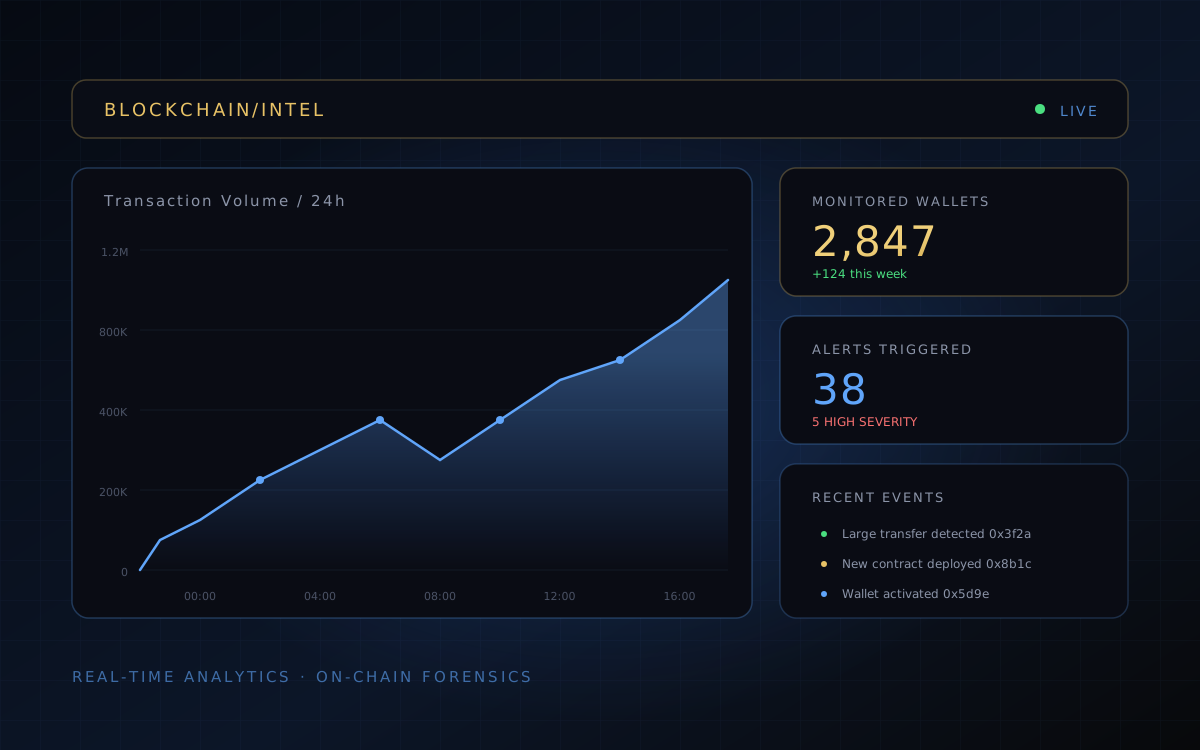
Overview
A front end over the monitoring work: rather than reading alerts as they arrive, this presents address activity over time with the context needed to tell routine movement from unusual movement.
Problem
Raw transaction lists are hard to reason about. Block explorers answer "what happened in this transaction" well, but not "how does this address usually behave, and is today different".
Solution
An indexing layer pulls history for watched addresses into local storage, and the interface renders it as time series and activity summaries. Reads hit the local index rather than an RPC endpoint, so exploration is fast and does not exhaust rate limits.
Architecture
A Node indexer fetches and stores history via Ethers.js. A Next.js app queries that store and renders with Chart.js. Indexing and presentation are separate, so the interface never waits on a chain round trip.
Key features
- Address activity over time
- Transaction history from a local index
- Charted volume and frequency views
- Multi-address watchlists
- Local indexing to avoid repeated RPC calls
Technology stack
Current status
A prototype running locally against my own watchlist. Not deployed publicly and the repository is private. The cover image is concept artwork, not a screenshot of a live product.
Links
No public repository or deployment for this project yet, so there is nothing to link here. I would rather leave this empty than point at something that does not exist — happy to talk through the work directly. Get in touch.